Plaque & Bleeding Indices
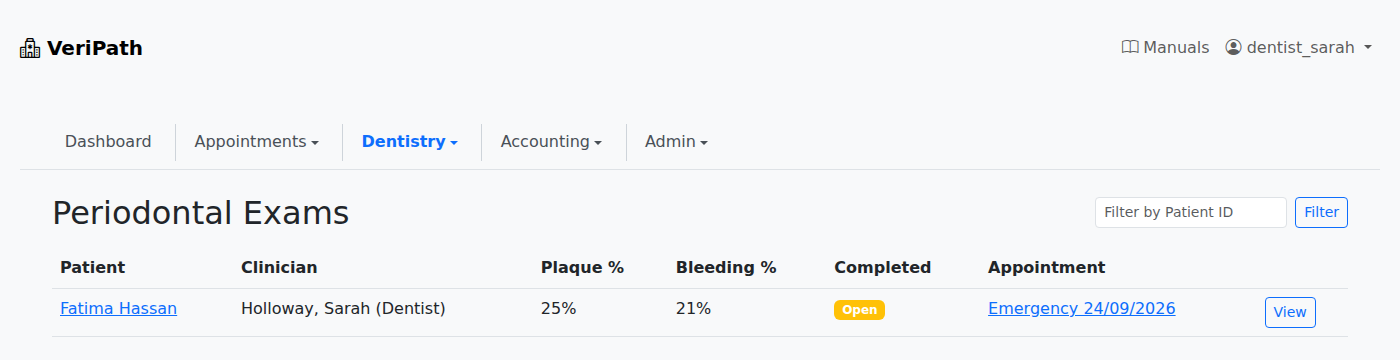
Two numbers tell a practice how a patient's gums are really doing: the share of probed sites carrying plaque, and the share that bled when they were probed. VeriPath Dental works both out from the charting itself, so the scores exist as soon as the clinician has probed — and nobody counts anything up afterwards.
The scores come from the charting, not from memory
Both indices are built from what was found at each of the six sites on each tooth: plaque present, and did that site bleed on gentle probing. There is no percentage to type and no separate scoring screen to visit — the two figures are the practice's own charting, added up.
One number that compares visit to visit
The exam list carries Plaque % and Bleeding % for every exam on the patient's record, so a change is measured against the last visit rather than remembered from it. Lower is better, and the direction of travel between two charts is the earliest warning a practice gets that plaque control has slipped.

The ticks behind the score
Bleeding and plaque are recorded site by site, at the point of probing, rather than graded by eye for the mouth as a whole. That is what makes the percentage mean something specific: it is a count of what was actually seen, and every charted site counts equally, so the more completely the mouth is charted the more the figure is worth reading.
A percentage that can be traced back
The exam's tooth records table carries the sites themselves — which sites of which tooth bled, which ones carried plaque — so the headline figure can always be followed back to the probing behind it. The two overalls are read-only everywhere in the app: nothing can be typed over them, so the number on the record cannot drift away from the tooth data underneath it.
Change the chart, and the score follows
Correcting a tooth while the exam is open recalculates both indices immediately, so the figure on screen is always the figure the chart justifies. A chart with nothing on it yet says so, rather than reporting a 0% that looks like a clean mouth.
Where the indices come from
Both scores belong to the full six-point chart, taken where it is clinically indicated — a check-up where screening has flagged deeper pockets, a gum-disease review, or before and after treatment. The quick screening exam that decides when a full chart is needed is recorded outside the app; these scores come from the full charting alone.
Clinical data, kept clinical
Periodontal records are clinical records: they live on the Periodontal screens, which reception does not have at all, and the scores travel with the patient's record rather than in a spreadsheet at the desk.
Part of the VeriPath Dental set
- Periodontal Charting — the six-point exam both scores are derived from.
- Gingival Recession & Mobility Scoring — the structural signs recorded on the same exam.